In a composite provider, you can now fill new characteristics or key figures using your own SQL!
This is an exciting function that can be used to elegantly solve many requirements. If you use this for key figures, however, it can happen that the result does not quite meet expectations and even changes if you include other key figures in the drilldown. Therefore, the behaviour will be analysed and explained here with a simple example. Then nothing will stand in the way of using this powerful function without any "nasty" surprises.
The blog is structured as follows:
- Presentation of the new functionality
- Explanation of the small example
- Surprising results
- Avoiding the "wrong" calculation „falschen“ Berechnung
The new functionality
If BW/4 is at a sufficient patch level (HANA 2.0 SPS 04), you will see the following new option in the composite provider:
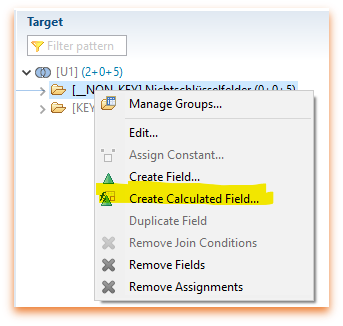
To generate a key figure from a numerical attribute, the following SQL is now sufficient:
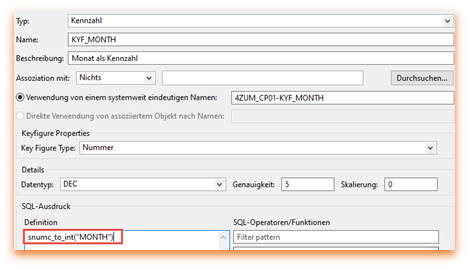
snumc_to_int( „ATTRIBUTE_NUMC“ )
This makes the composite provider much more powerful and probably avoids the use of a calculation view or the creation and filling of a new key figure/characteristic in the aDSO. In particular, avoiding the Calculation View helps to avoid introducing yet another technique. In addition, access directly to HANA is not always desired.
This function is well described in the SAP release information (https://help.sap.com/viewer/b3701cd3826440618ef938d74dc93c51/2.0.6/de-DE/d8b12ec099e04e6aa77a312be687db63.html) and in this nice blog https://www.brandeis.de/en/blog/sql-expressions-in-bw-4hana-composite-provider-hcpr/
Small example
Let's take a look at the following example. (The example does not claim to make any technical sense, it is only intended to make the results easy to understand with simple numbers and calculations ? Likewise, there may be other approaches to solving the problems, but these will not be considered here. We only want to understand the function of the SQL processing).
We have an aDSO that is structured as follows:
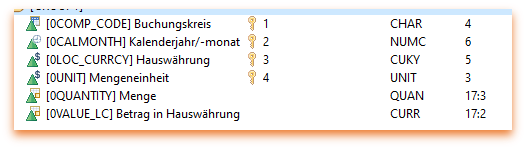
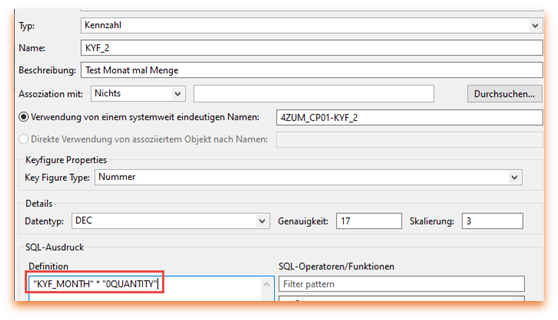
Now we want to add the following key figures in the Calculation View:
Weight quantity with month, i.e. quantity in January * 1, February *2 etc.
So that all steps can be controlled, these are created as individual characteristics or key figures. Of course, this would also be possible in one step
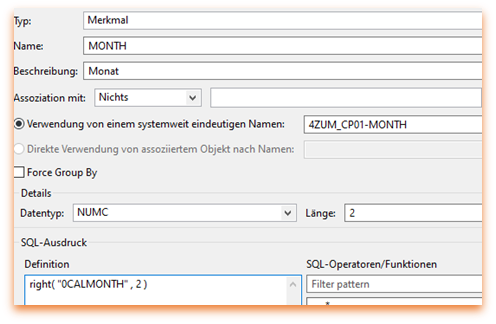
In a first step, we get the month from 0CALMONTH.
Then we convert the month into a key figure.
Finally, multiply by the quantity.
In another example, the entries with EUR as currency are to be counted, i.e. the key figure should always contain 1 if the currency contains EUR. This can be done with the following SQL statement:
CASE „0LOC_CURRCY“
WHEN ‚EUR‘ THEN 1
ELSE 0
END
Surprising results
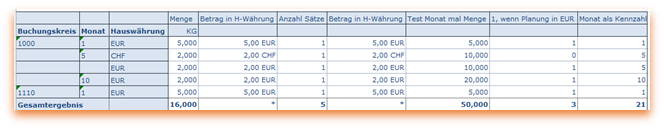
If all attributes are drilled down, the calculation is done as we intuitively expect:
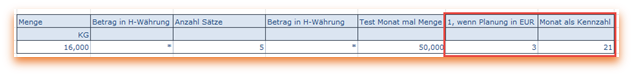
If no attributes are displayed in the simple query / listcube, we get the following result:
- counting the months with EUR delivers one month too few (penultimate, expected 4, now 3)
- the sum of the months as a key figure gives a different result (last column, expected 22, now 21)
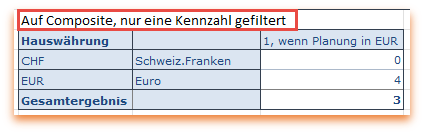
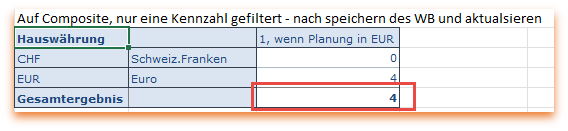
It gets even more confusing if we only look at the key figure for counting the months with EUR and display the currency. Both times we have the currency in the rows, and only the one key figure in the column, but beware:
- The report on the composite that filters the key figure gives the expected result of 4, but in total, only 3!
- If you save the workbook and refresh it, the total result is suddenly displayed as 4, as expected.
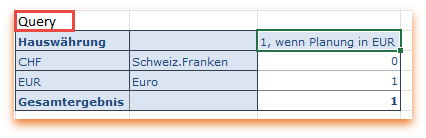
- A query with only one key figure in the columns, however, only returns 1.
Reason for the "wrong" results
To optimise performance, the data is always aggregated as much as possible first and then the SQL for the new characteristics is executed in the composite provider.
So if two attributes are needed in the calculation, the data is aggregated to that level, the calculation is performed and then aggregated further if needed for the display.
The calculation of all key figures used is carried out on the same level, i.e. if several calculations have to be carried out, then aggregation is only carried out to the extent that everything can be calculated at the same time.
This means that the calculations can be different, depending on which key figures are to be displayed at the same time. If all characteristics are in the drilldown, then the calculation takes place at the lowest level.
In our case, the month and currency are needed to perform the calculation for all formulas as expected. Therefore, if all key figures occur but no characteristics are in the drilldown, the calculation is first summarised to this level. The fact that we have figures in EUR in two company codes in January does not matter, as this line only occurs once and is therefore only counted once. Therefore, we only get a 3 here instead of the 4. If we also let the currency be displayed, then another logic seems to apply to the individual lines, which now leads to a 4 here again. It gets even more confusing if you save this representation and update it again. Then all of a sudden, the overall result is correct.
If we have only requested the key figure for counting the EUR numbers in the query, then a summarisation down to the currency takes place here before the SQL is executed. Therefore, we get the 1 for once expression EUR.
Force "correct" calculation
Fortunately, there is the possibility to convince the query to calculate "correctly".
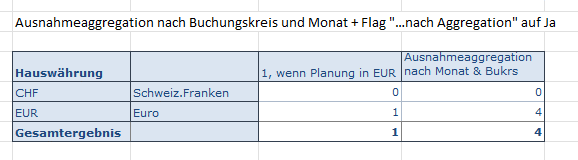
To do this, we need to change two settings. First, we create a formula that takes the actual key figure and for which we define the exception aggregation:
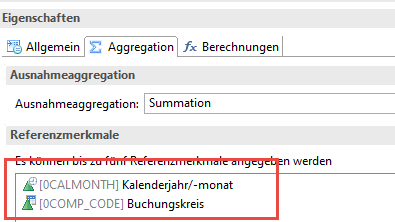
All features that we want to take into account in the calculation are to be entered as reference features. Since a maximum of 5 characteristics are allowed here, this procedure is certainly not suitable for every model. But often we do not need all characteristics of the model here, but only those that can differ independently or that are to be considered in the count. For example, in many models the document number is probably sufficient.
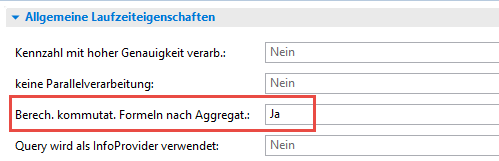
Surprisingly, this exception aggregation alone still does not result in a correct calculation. Only when the setting "Calculate. Commut. Formula according to aggregate:" is set to Yes, the "correct" result comes out:
We have not tried whether you can force the calculation on a lower level by addressing the characteristics in the formula or assigning them to a key figure for which an exception aggregation is stored. As always, there are certainly many more ways to get to the target.
Independently of the solution presented here, such a question can often also be solved in a query with formulas. However, this is then limited to a single query and has similar limitations.
Conclusion
Even if the explanations and the behaviour sound confusing at first, the software follows simple rules ? as always. Once these are understood, the new functionality can be used without any "nasty" surprises. Have fun!
Contact Person

Dr. Ulrich Meseth
Senior Consultant

")


