Using the example of a story in the "integrated Financial Planning (4RC)" package
One argument for planning in SAC that SAP likes to market as a great advantage is the planning content. This promises to be a template for the "classic" planning processes in most companies. One only needs to activate it and can then immediately begin with corporate planning or at least with little effort to adapt it to one's own company. Finally, such content is also available for SAC.
With this blog I would like to share my first impressions and show what I find good and where I still suspect a need for adaptation / expansion. But let's take it one step at a time.
"Integrated Financial Planning (4RC)" package
To see whether SAP's content can live up to expectations, I took a look at the Integrated Financial Planning (4RC) package, which serves the "classic" process of integrated financial planning.
SAP describes the guidelines for implementation and testing in their "Best Practices Explorer", help can be found in the help pages. Here you should always look for the latest release, as the documentation is also continuously improving!
https://rapid.sap.com/bp/#/browse/categories/sap_s%254hana/areas/cloud/packageversions/BP_CLD_ENTPR/S4CLD/2011/US/22/EN/scopeitems/4RC
https://help.sap.com/viewer/1cbcff7ccd35405ab445b223c1ab1588/2011.500/en-US/a2b35263477b4895a301a8d544dea775.html
https://help.sap.com/viewer/1cbcff7ccd35405ab445b223c1ab1588/2102.500/en-US/c27e528a759346c89e27fec93b037cc9.html
Of course, I am not the first person to write a blog on this topic:
https://blogs.sap.com/2020/12/01/financial-planning-options-in-s-4hana-2020-release/
https://blogs.sap.com/2021/02/12/simulation-cockpit-for-financial-planning-in-sap-analytics-cloud/
The data flow that SAP shows for this model actually contains everything that is involved in the classic budget process:
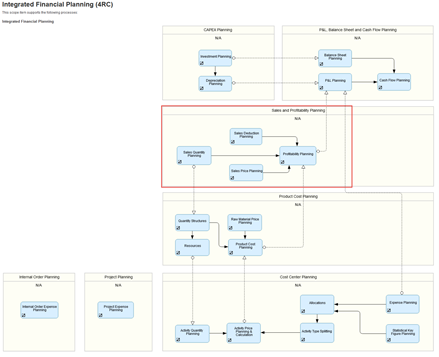
Figure 1 Source SAP: https://support.sap.com/content/dam/SAAP/Sol_Pack/Library/ProcessDiagrams/4RC_S4CLD2102_Process_Overview_EN_XX.html
Installation of the planning content
The planning content is quickly imported into your own tenant. Sample data is also provided. This means you can start testing immediately! This is exemplary!
Story „SAP Finance BPL – Sales Planning“ [SAP__FI_BPL_IM_PROFITABILITY_REV_INPUT]
Since I have already implemented some sales planning for customers in my last projects, my first reach was for the story for sales planning - pure revenue view (red bordered area in the data flow above).
This story is almost identical to the story "SAP Finance BPL - Sales & Profitability Planning" [SAP__FI_BPL_IM_PROFITABILITY_PROF_INPUT]. In this story, the cost side is calculated in addition to the revenue side, and the complete P&L per customer/product is displayed at the end. Therefore, please be careful which story you open!
Somehow I have not found a description of how this planning is to be operated (or have I overlooked this somewhere in the depths of the SAP Net?). Therefore, here is a summary of how I imagine the handling of this story.
There are the following tabs in this story:
- Quantity & Revenue
- Quantity Parameter Setting
- Price
- Sales Deductions %
- Sales Deductions
How to plan here
The entry is made in the order of the individual tabs from the story. But you should not always immediately use all the functions and inputs that are available! This sequence seemed to make sense to me when entering the planned figures:
- Take the suggested quantities and prices from the actuals (via a function on the first tab).
- Adjustment of the quantities in the first tab. The turnover can already be calculated with the old prices via a function.
- Support of quantity planning via the functions in tab 2, which allows a distribution of the planned values over various parameters.
- Adjustment of prices per product in tab 3
- Entry of discounts per customer in tab 4
- Calculation of turnover incl. discounts per customer via the function on Tab 1 or Tab 5.
- Finally, the turnover and absolute discount can be corrected again for each customer/product.
And now all tabs in detail one after the other.
Tab 1 – Quantity & Revenue
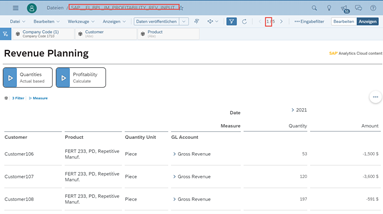
In tab 1 you can enter the quantities and the turnover. With the button "Quantites - Actual based" first the existing planned figures incl. prices and discounts are deleted and then the actual figures from the planned year - 1 are taken over for the exact month. The average prices from plan year - 1 are calculated. Discounts are also taken over from the planning year - 1.
The planned turnover is calculated on the basis of the prices and quantities by pressing the button "Profitability - Calculate".
Quantities can now be adjusted manually. You should wait until you have updated the adopted planned prices (in tab 3) before adjusting the turnover! These are always recalculated when the "Profitability - Calculate" button is pressed.
A pre-assignment from the actual helps in planning. But surely a previous year's period will not be filled for every planning period. A customer-specific adjustment is certainly necessary here.
New customers / material combinations can be added to a characteristic via the context menu.
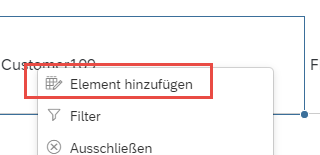
Then fill in all characteristics accordingly in the new line.
An individual account must be selected for the account. The entry of the quantity is now acknowledged with an error message. First you have to enter a turnover and transfer it. Now you can enter a quantity and calculate the turnover from the price. But beware, after entering the quantity, the account is automatically no longer displayed, but only the hierarchy node for the accounts. If you now enter the quantity on the node, it will be distributed to all accounts below, not only to the account where you entered the first amount.
Please note that quantities are displayed without decimal places, but in the calculation of turnover, decimal places are used! This is particularly noticeable when you expand the months or spread them over several sub-accounts.
Tab 2 – „Quantity Parameter Setting“
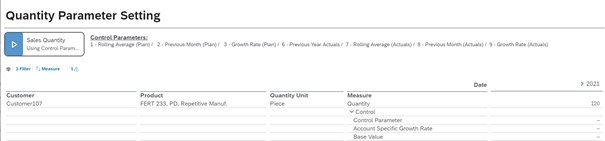
Control parameters can be used to flexibly suggest the planned figures for a material-product combination. In principle, this is a good idea, as different rules can be applied for each month.
Since the control parameters occur in several places and are only partially self-explanatory, here is a description of the functions behind them. I have derived the behaviour from the planning function used. After the overview, I will show this in detail with an example.
Meaning of the control parameters:
| Nr. | Description | Bedeutung |
| 1 | Rolling Average (Plan) | New planned value is the average of the last three months, but only the planned value, actual months are taken into account with 0! The first month is not changed. Therefore, 1/3 of the plan value of the first month is used in the second plan month, unless old plan figures are still available! |
| 2 | Previous Month (Plan) | Planned value of the previous month. Nothing is changed in the first planning period |
| 3 | Growth Rate (Plan) | Here, the percentage increase between the planned values of the two previous months is updated. Thus this parameter only makes sense from the 3rd planned month onwards.
Example January 100, February 110: Basis for Mrch = 110 / 100 * 110 = 121.0 |
| 6 | Previous year (Actuals) | The actual value exactly 12 months ago is used. This is identical to the behaviour from the function on the first tab. |
| 7 | Rolling Average (Actuals) | The average of the last 3 months from the actual figures is used here. This parameter only makes sense if rolling planning is carried out month by month. Otherwise, only actual figures from the last 2 actual periods are available from the second planning period onwards. |
| 8 | Previous Month (Actuals) | The data from the previous month also only makes sense if it is rolled forward month by month. |
| 9 | Growth Rate (Actuals) | As with the growth rate (plan), the percentage increase of the last two actual values is updated. This only makes sense if the corresponding actual values for the last months are already available. |
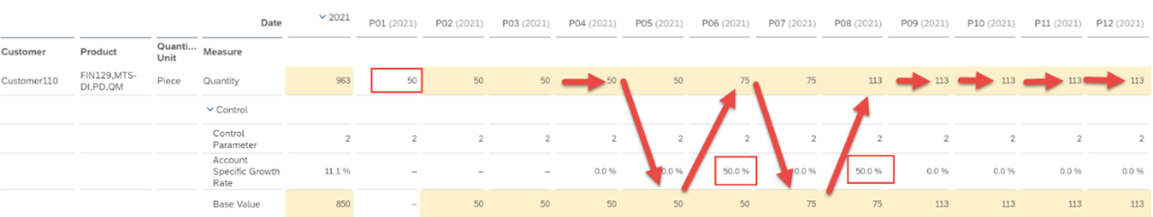
| – | Account specific growth rate | Independently of these formulas, one can still enter a percentage increase for each month in this line, which is then additionally taken into account. |
| – | Base Value | The value to which the "Account specific growth rate" is applied is entered in this line. This value is an auxiliary value and is overwritten with each new calculation. |
All in all, this actually provides a flexible construct for calculating target figures. Unfortunately, the performance of the calculation is not particularly fast, even for a product-material. This makes input and calculation tedious. Reuse of the parameters for several product/customer combinations does not seem possible, so each combination must be entered individually.
A function for reusing parameters that have already been set for automatic transfer to different products/customers will certainly be necessary in the customer project in order to make the entry efficient and convenient.
Here again the behaviour in detail for a parameter.
Example: 2 - Previous Month (Plan)
All parameters are implemented in the data action SAP__FI_BPL_IM_PROFITABILITY_CREATE_CTL_PARAMS. In the graphical representation of this function, the calculation can be easily understood for the corresponding case:
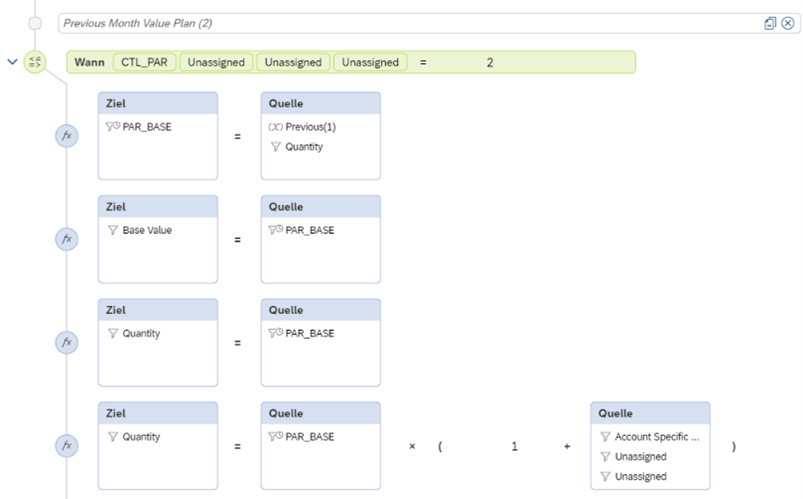
The previous month's value is simply used. Since the same version is used, only the planned value is used. The rate of increase is then additionally applied to this. This results in the following picture:
Tab 3 – Price Adjustments
Here we can adjust or record the prices used in Tab 1 and 5 to calculate the sales from the quantities.

To define prices for different regions, you have to play with the accounts! I can enter the sales quantities in different accounts, and the price is then calculated on the basis of these. In the example data, there are prices for "Domestic-Product" and "Foreign-Product". Since this price can be maintained differently for a product, this account description probably refers to sales in the country of production or outside. Here it is necessary to check whether this fits your own account model.
A frequent request in sales planning is to always plan sales and prices in the transaction currency to make it easier to calculate the effect of currency fluctuations later. Since here it is only intended to enter the planning in the local currency of the company code, this may have to be extended.
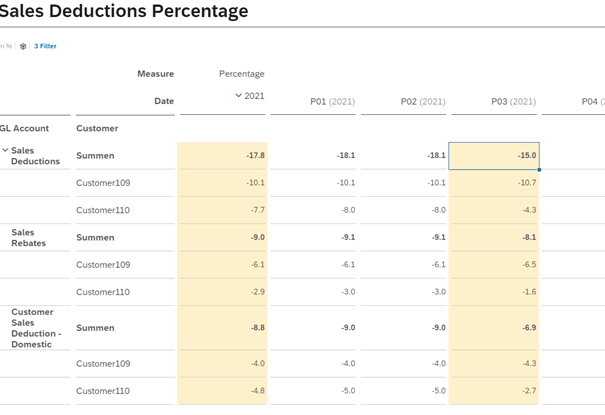
Tab 4 – Sales Deductions Percentage
Since the prices are maintained per product, customer-specific price adjustments are to be maintained via price reductions. You can even use different categories here. These are calculated from the actual data and proposed in the corresponding function in Tab 1.

It gets trickier when you want to maintain discounts for several customers at once, for example. You can change the order of account and customer in the display and have the totals shown for the customers. But then the discount is a real sum and not the average. But at least you can then, for example, double the existing discount in a month or fill it with a certain value via the mass data entry.
If you want to adjust prices individually for a product/customer combination and these values are not to be overwritten in the next sales calculation, you will also have to extend this accordingly.
Tab 5 – Sales Deductions
On this tab the sales deductions per customer / material including discounts will be calculated if you press the button "Profitability - Calculate". In this story only the sales revenues are displayed, but with the formula also the product costs are updated, which can be maintained in the story Sales & Profitability Planning [SAP__FI_BPL_IM_PROFITABILITY_PROF_INPUT]! If this is to be done by different users, then these calculations should be separated.
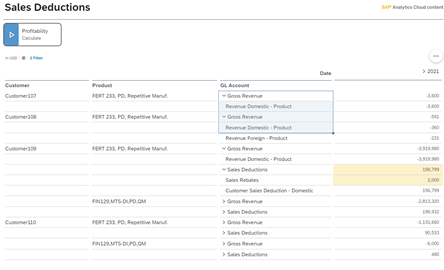
Here, too, all values can still be adjusted manually. But be careful, these changes will be overwritten when the function "Profitability - Calculate" is executed again. It therefore makes more sense to correct the values via Prices / Quantities / Discounts.
Conclusion
This story is a nice example of sales planning using a small test example. The planning of a larger number of customers / products is probably not to be carried out effectively with this. For this, the layout must still be adapted, e.g. with a grouping per customer or an additional layout with access via a product.
Author:

Dr. Ulrich Meseth
Senior Consultant
biX Consulting GmbH & Co. KG

")


