August 2026
Introduction
What we need to do
First let us have a look at what we have to do. The following picture gives you an overview of the required task:
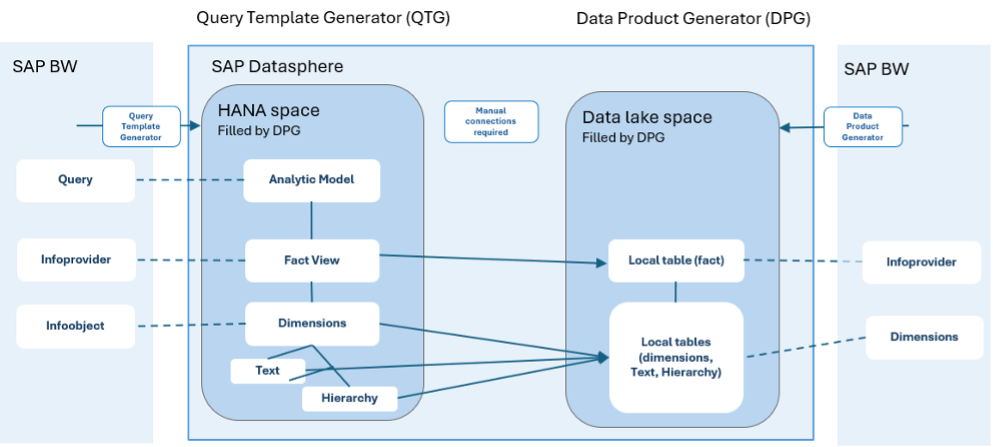
Figure 1: Overview of Query Template Generator (QTG) combined with the Data Product Generator (DPG)
In the QTG an analytic model is created using a fact view and dimensions pointing to empty tables. These empty tables have to be replaced to point and read the data from the table generated by the data product generator. Later these tables may have to be combined with additional datasources for new data, not coming from the original BW. The following challenges have to be addressed:
- Naming of Dimensions is different
- Content dimensions are named with leading 0 in the QTG, without in DPG
- Customer dimensions are named with leading /BIC/ in DPG, without in QTG
- DPG is storing the objects in a data lake file space, QTG in a HANA database space.
- If there is no technical name given in the query, a GUID is used and generated in the QTG. Identifying the correct key figure columns in the query may be a challenge.
- The QTG will generate for all infoobjects and attributes in the underlying infoprovider, e.g. composite provider, artefacts in Datasphere, if used or not in the query! Even with small models a lot of objects will be created, e.g. in our test case with only few infoobjects OTG generated over 50 objects in Datasphere. All these objects have manually to be mapped to tables with the migrated data.
Let us have now a closer look at all of these challenges.
Which Query to Migrate
As mapping of all attributes is a little bit of work, we first should have a look at which query to migrate and how to prepare.
What will the migrated query be used for in our new environment? With the QTG for each query an analytic model is created. This model will then be used within the SAC as datasource. Thus, we do not need to migrate each query created to simplify creation of a report which differs just in the dimensions selected / filtered etc. Instead, we should focus on very few queries per infoprovider containing all filter and calculation logic in the columns and structures.
How to prepare a Query for Migration
When preparing a query for migration we should consider the following topics:
- Technical names of structure elements in the query
- Free dimensions and attributes displayed in the query
Technical names of structure elements
In case your query has structures or restricted key figures then the QTG will either use an existing technical name in the query as ID for the elements in the analytic model. If no technical name given, the QTG will use a GUID to name them. When you then consume this analytic model in SAC you will see only the generated IDs when you work with them. In the table the correct description is shown, but unfortunately not in the layout for the table definition. To avoid guessing which structure element contains what you should maintain technical names already in the query definition. These names are then used instead of generated IDs making table definitions easier.
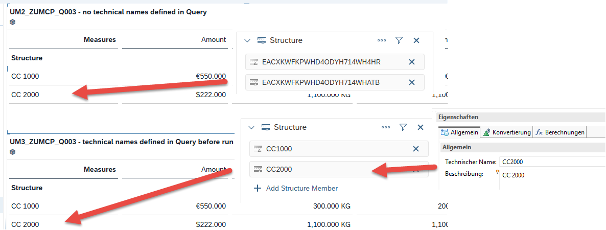
Figure 2: Identical outcome for structure elements with and without technical name defined in query, but selection shown is using cryptical ID if no technical name defined
Free dimensions and attributes
Auch wenn das QTG Artefakte für ALLE abhängigen Objekte in Datasphere und der Faktenansicht generiert, markiert es nur diejenigen, die in der Query verwendet werden, als im Analtic Model sichtbar – und somit später auch in SAC, wenn die Daten genutzt werden.
Thus you either add all relevant dimensions as free dimensions in the query and show all attributes, you want to be able to display later in SAC in the query. If you miss this, you can later adjust this as well in the analytic model.
Fact view correction
Sharing, mapping of dimension names
DPG will store our data in the data lake space our analytic model of the QTG is in a HANA database space. So first thing you have to do is to share your required DPG tables to the space you used for the QTG.
Next step is to map the different technical name logic between QTG and DPG. For whatever reason SAP decided to use two different logics for the mapping of technical names.
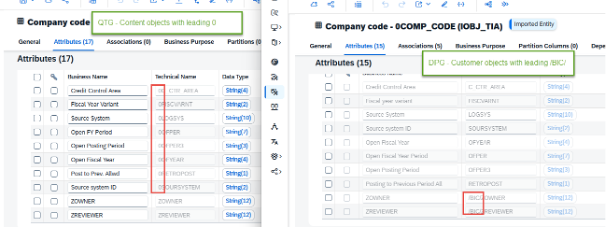
Figure 3: Mismatch in technical names between QTG and DPG
We solved this problem for the fact table by creating a View(fact) similar to the view created by the DPG but replacing the from selection with our shared view. If your model used navigational attributes you may have to adjust several tables.
Now the view will have a syntax error, as the columns in the DPG tables have different names. Adjust now the column names accordingly, but keep the AS field name untouched.
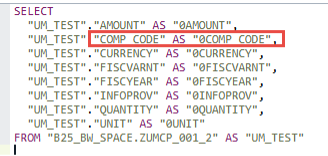
Figure 4: Corrected view (Fact) to select from DPG table – from table to be replaced and field names to be corrected (remove 0 or add /BIC/) Tabelle hinter FROM ersetzt und den korrigierten Feldnamen (0 entfernen oder /BIC/ hinzufügen)
Replace view in analytic model
As last step open the analytic model generated by the QTG and replace the fact data source by the just created fact view by drag and drop. If all columns can be found, then a message similar to the following message should be shown.
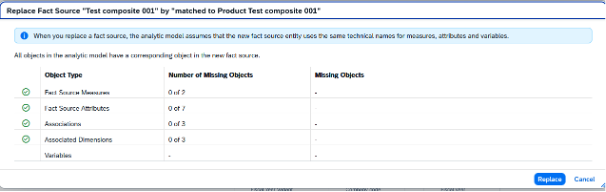
Figure 5: Confirmation popup after replacing the source in the analytic model
Just replace and deploy. Now your data model based on your query is ready for consumption. In the data preview you can check the outcome.
The impact– analysis will show our simple data flow for the test case.

Figure 6: Impact analysis of migrated analytic model combined with a DPG - table
With these changes you can already create an SAC – report on the data and all values should be visible as expected. But you do not have any attributes of text available for your dimensions.
Correction of Dimensions
Let us have now a look how to change the dimensions. If you look at the dependency analysis for our simple model (only two dimensions plus time ) you already see a lot of dependencies. We will have to replace all source tables required. Suggestion is first to check, which dimensions and attributes are really required in your data model and analytic model. All other tables you can either ignore or remove dependencies.
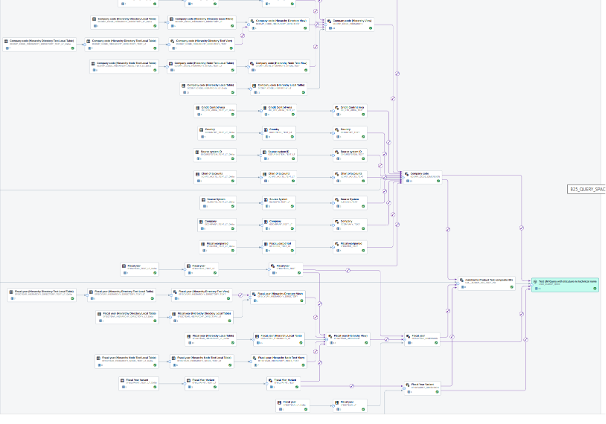
Figure 7: dependencies of a model generated by the QTG
If you try to change the source in the view for the dimension, the view cannot be deployed as all associations to the attributes are lost upon the change of the source.
We found the following solution:
- Export JSON – Definition of the Dimension view
- Replace source table and field mapping in the JSON file
- Upload JSON definition
Have a look at each of the steps
Export the JSON definition is straight forward using the export functionality in the data builder of the view.
Now you have to open the JSON file and replace the source table by your table of the DPG (you have as well shared to the correct space) and the fields used by the correct QTG names, thus removing the 0 or adding /BIC/.
This has to be done twice, once, in the definition of the query behind “query”: and a second time in the definition of the SQL view shown in the graphical interface behind the tag @DataWarehouse.sqlEditor.query.
Überprüfen Sie außerdem, ob Datentyp und Länge der Spalten übereinstimmen. Da beide Tools dieselbe BW-Quelle auslesen, sollte dies eigentlich der Fall sein. Beim Buchungskreis stimmten alle 15 Spalten überein, doch die Hierarchietabellen zeigen, dass dies nicht als selbstverständlich angesehen werden kann (siehe unten).
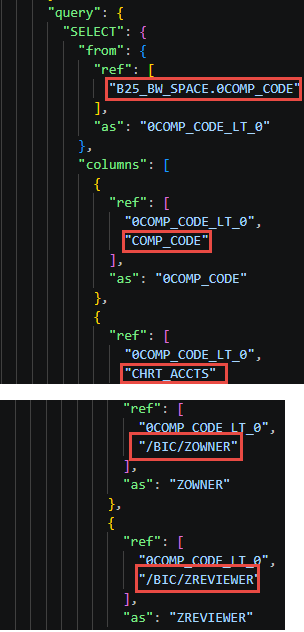
Figure 8: corrected table and attributes in the query definition

Figure 9: Required changes in the SQL Editor definition
During import started from the overview page of the data builders in your space, you will be asked if the dependent objects should be updated as well. As we did only change one dimension, we declined.

Figure 10: Confirmation popup during import of corrected JSON file for a dimension
If you did not make any error during edit, the source of the dimension should be replaced. Make sure that the attributes are marked in the analytic model. Now you should be able to select them in the SAC when creating a table.
After the switch the empty *_LT tables generated by the QTG are no longer used or needed. Deleting them is probably wasted effort, as the next run of the QTG for another query will create them again.
Texts and Hierarchies
Texts
The same procedure applies to the text views. In our example the text of the company code is defined as language-independent in BW. The DPG therefore correctly exports the text table 0COMP_CODE_text without a language key. The QTG does not take this into account and generates the text view 0COMP_CODE_TEXT with a language key (LANGU) as part of the key. To combine the two you either have to set the language to a fixed value in the JSON, or remove the language from the view – which then has to be removed from all relations as well and is likely to be laborious. Text tables which are language-dependent in BW (e.g. the hierarchy directory texts) have a language key on both sides.
Hierarchies
Export of hierarchies with the DPG is possible since June 2026 (SAP Help: Data Product Generator – Hierarchies). We generated a hierarchy for 0COMP_CODE following the SAP Hilfe (important: choose source type “Snapshot”). The DPG creates four tables per infoobject, which map 1:1 to the views generated by the QTG. But unfortunately the fields have different length for some fields. Thus it is a little bit more than simple mapping, you first have to correct the field length and different logic used. Therefore we did not try to match the hierarchy and stopped this test so far. Perhaps SAP will align the logic of both tools to make such mapping possible with a reasonable effort.
Where we can help you
Mapping the fact view and the dimensions manually is possible. But as soon as your model has some complexity, manual correction of names and tables is very time consuming with risk of typing errors. We have therefore taught our AI agents to do this work. All the manual steps shown in this blog were executed manually and by the agent in parallel. In addition the agent will check the outcome and verifies better than we can do if the result data is as expected.
Conclusion
With the two tools from SAP, the DPG and the QTG you can migrate your reports from an BW system to a Datasphere tenant as basis for SAC reports. Combining the QTG data model with the DPG data is possible, but a little bit tricky and cumbersome. Let us hope, that both teams of SAP developing DPG and QTG will start to align the naming logic to make manual mapping possible without renaming effort required.
If you do not want to wait for SAP, we can help you with our biX AI agent, which helped as well to find the solution described in this blog and proofread the blog.