Im März kamen durch das Q2 2021 Release mehrere neue Funktionen zur SAC hinzu. Unter anderem eine Möglichkeit, die Datenmodellierung flexibler und effektiver zu gestalten. Ein neues Modell wird dem Modellierer zur Verfügung gestellt, mit dem jetzt auch Kennzahlenmodelle erstellt werden können.
Bis jetzt war es in der SAP Analytics Cloud nicht möglich, Kennzahlenmodelle abzubilden. Wenn die Datenquelle in einem System als Kennzahlenmodell vorlag, musste mit einem zusätzlichen Aufwand ein Mapping von einem Kennzahlen- zu einem Kontenmodell vorgenommen werden, damit die Daten auswertbar/planbar wurden. Jetzt ist dies endlich Geschichte. Die SAC ermöglicht beides in einem Modell.
Dieses neue Datenmodell wird in diesem Artikel als Hybridmodell bezeichnet. Hybrid, weil aus einem Hybridmodell sowohl ein Kennzahlen- und/oder ein Kontenmodell erstellt werden kann. Dieses Modell wird, so scheint es, zukünftig das alte Datenmodell (hier bezeichnet als Classic Account Model (siehe Abbildung 1)) ersetzen und rückt somit in den Fokus für neue Entwicklungen und Funktionen.
Das neue Datenmodell auf der SAC kann genutzt werden, indem Sie…
- Start with a blank model auswählen und dann bei der Auswahl in der unteren Abbildung 1 auf New Model klicken oder
- Bei einem bestehenden Modell (Classic Account Model) die Funktion Migrate to New Model Type unter Edit auswählen (siehe Abbildung 2)
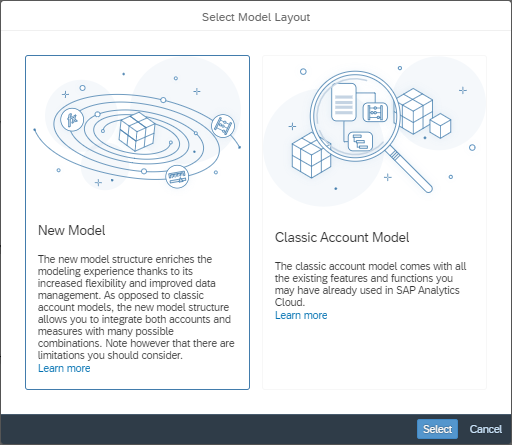
Abbildung 1: Create New Model -> Blank Model -> New Model
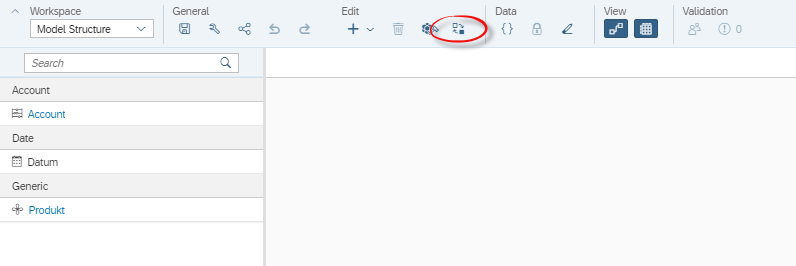
Abbildung 2: Workspace Model Structure -> Edit -> Migrate (rot markiert)
In diesem Artikel soll ein Einblick in das Hybridmodell gegeben werden, wie es zu handhaben und was bei einer Migration von bestehenden Modellen (Classic Account Models) zu beachten ist.
Erste Eindrücke
Das Hybridmodell ermöglicht es endlich, Kennzahlenmodelle zu erstellen und somit völlig neue Szenarien aufzubauen. Es wird wichtiger sich Gedanken zu machen, wie seine Modelle auf der SAC modelliert werden sollen, weil dadurch Datenmengen verringert und verbessert werden können. Des Weiteren ermöglicht es auch bestehende Datenmodelle aus anderen Systemen, die bis dahin noch nicht anbindbar waren (außer mit zusätzlichen Mapping auf ein Kontenmodell), an die SAC anzuschließen.
Weiter Unterschiede
Neue Zahlentypen
Eine weitere Neuerung, die mit dem Hybridmodell kommt, sind neue Zahlentypen z.B. Integer. Es wird somit ermöglicht in Zukunft endlich ganze Fahrräder zu planen, ohne den Workaround mit Nachkommerstellen einzurichten, mit der Gefahr, dass bei Berechnungen im Hintergrund aufgerundet wird.
Kein automatisches Anlegen von Stammdaten
Bei dem Classic Account Model werden neue Stammdaten beim Beladen automatisch angelegt. Dies geht bei dem Hybridmodell (noch) nicht. Beim Beladen ist somit sicherzustellen, dass vorher alle Stammdaten gepflegt sind.
Währungsumrechnung
Ebenso sind die Möglichkeiten zur Währungsumrechnung während der Planung erweitert. Jetzt kann man z.B. Werte in Transaktionswährung erfassen und während der Eingabe direkt in Buchungskreis- und Konzernwährung umrechnen lassen, bevor man die Daten überträgt! Dies erleichtert eine konsistente Erfassung.
Berechnete und eingeschränkte Kennzahlen
Außerdem können nun berechnete und eingeschränkte Kennzahlen erstellt werden, ohne diese über Account erstellen zu müssen.
Datenmodell aus Datensatz erstellen zu lassen, geht nur für Kontenmodelle
Diese neuen Funktionen ermutigen, Neuentwicklungen im Hybridmodell zu erstellen. Leider kann das Hybridmodell nicht aus einem Datensatz generiert werden, es muss immer erstellt werden. Es macht keinen Unterschied, ob die Datenquelle als Konten- oder Kennzahlenmodell vorliegt. SAP generiert immer ein Kontenmodell, dass manuell in ein Hybridmodell migrieren kann (s. nächstes Kapitel).
Migration
Das Auffallendste bei einer Migration ist, dass der bekannte Data Wrangling Editor entfällt. Das bedeutet, dass es seitens der SAC noch keine Funktionen gibt, welche Anpassungen ermöglichen, bei der Übertragung der Modelle. Dort wäre eine Mappingfunktion gut aufgehoben gewesen, um aus einer Kennzahl mehrere zu befüllen (abhängig von der Account Dimension). Nach dem Aktivieren Migrate to New Model Type wird das alte Modell gelöscht und SAC erstellt ein Hybridmodell. Wenn ich mit der Migration nicht zufrieden bin, gibt es kein Undo! Somit ist es sehr wichtig, dass vorher einige Schritte vorbereitet werden.
Es sollte niemals ein Modell, welches genutzt wird, migriert werden. Dies ist auch nicht möglich, da Stories nicht migriert werden können. Besser ist es, ein Duplikat von dem zu migrierenden Modell zu erstellen. Dieses Duplikat hat keine Verbindungen zu Stories und kann somit migriert werden. Die Stories müssten entweder neu händisch gebaut werden oder Sie versuchen es, indem Sie die Stories auch duplizieren, und das Hybridmodell als neue Datenquelle hinterlegen/austauschen.
Es ist außerdem zu beachten, dass die Währungsumrechnung ausgeschaltet wird, sonst kann keine Migration erfolgen. Nach der Migration kann die Währungsumrechnung wieder angestellt werden. Import Jobs werden auch nicht migriert. Somit sollten alle migrierten Modelle darauf untersucht werden.
Ein weiterer wichtiger Punkt ist, dass bei der Migration von bestehenden Kontenmodellen die Eigenschaften der Einheit wegfallen. Auf dem alten Classic Account Model kann über die Dimension Account die Einheit & Währung eingestellt werden, wie in der Abbildung 3 zu sehen ist.
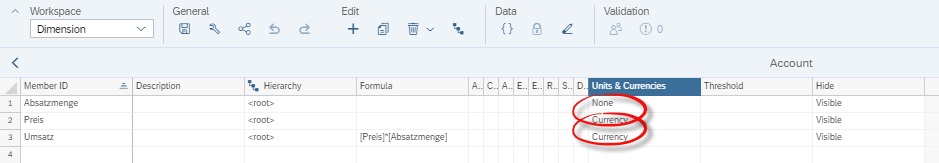
Abbildung 3: Classic Account Model: Dimension Account
Eine Story auf diesem Modell zeigt auch die Einheiten & Währungen aus der Dimension Account entsprechend mit den Symbolen (siehe Abbildung 4).
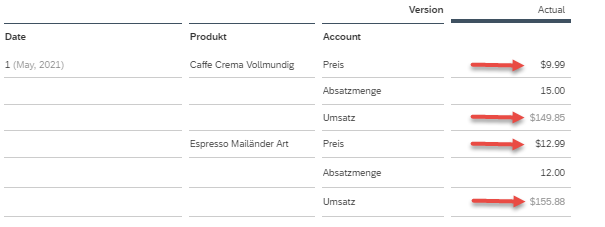
Abbildung 4: Story auf einem Classic Account Model
Auf der Abbildung 5 ist zu erkennen, dass die Währungssymbole nach der Migration entfallen. Dies kommt daher, dass das Hybridmodell keine gemischten Kennzahlen kennt. Die automatisch generierte Kennzahl hat ein Feld, wo auch die Einheit & Währung eingestellt werden können. Jedoch muss man sich entscheiden, ob diese Kennzahl Einheiten oder Beträge enthält. In dem gezeigten Beispiel sind im zu migrierendem Kontenmodell Mengen- und Währungseinheiten. Nach der Migration werden die Kennzahlen entweder alle als Erträge oder Mengen interpretiert. Es gibt jedoch auch die Möglichkeit eine einheitlose Kennzahl zu erstellen. Diese Einstellung ist in der unteren Abbildung zu sehen. Dabei muss bei der Berichtserstellung darauf geachtet werden, dass der Anwender seine Kennzahlen korrekt interpretiert.
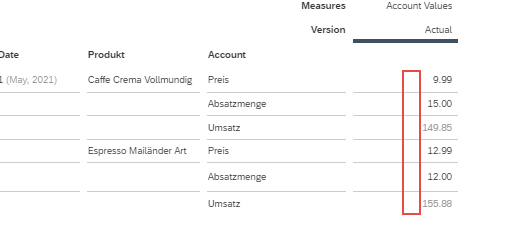
Abbildung 5: Story auf einem Hybriden Model (nach einer Migration)
Dies ist noch das größte Problem des Hybridmodells. Um die Migration vollständig zu beenden, müssen die Kennzahlen auf mehrere Kennzahlen (Betrag, Menge) aufgeteilt werden (siehe folgendes Gedankenspiel).
Gedankenspiel
Um eine vollständige Migration zu ermöglichen, ist dann doch noch manueller Mehraufwand nötig. Eine Idee wäre, dass das zu migrierende Classic Account Model so oft dupliziert wird, wie verschiedene Einheiten in dem ursprünglichen Model vorliegen. Jedes der duplizierten Classic Account Modelle müsste nun auf eine Einheit im Modell gestutzt werden, sodass in unserem Fall ein Modell mit nur Mengeneinheiten und ein Modell mit nur Währungen vorliegen. Diese könnten dann einzeln migriert werden. Nach der Migration muss der automatisch erstellten Kennzahl die entsprechende Einheit zugeordnet werden.
In einer Story könnten dann die beiden Modelle hinterlegt und miteinander verknüpft werden. Diese Funktion heißt Data Blending. Hierbei gibt es jedoch zu Limitationen. Weitere Informationen zu Data Blending (https://blogs.sap.com/2019/11/05/sap-analytics-cloud-blending-information-part-1/).
Alternativ könnten durch eine DataAction die Werte eines Modells in eine neue Kennzahl des anderen kopiert werden.
Dadurch könnte ermöglicht werden, dass die Daten gemeinsam auswertbar bleiben.
Fazit
Das Hybridmodell erfüllt schon einen lang ersehnten Wunsch, Kennzahlenmodelle nun auch abbilden zu können. Dies ermöglicht Flexibilität in der Datenmodellierung, sowie mögliche Performancevorteile. Außerdem können nun weitere Datenquellen an die SAC angeschlossen werden, die vorher durch ihr Kennzahlenmodell nicht angeschlossen werden konnten. Neu erstellte Datenmodelle werden meistens auf dem Hybridmodell entwickelt werden, weil dies mehr Flexibilität bietet.
Bei der Migration von einem Classic Account Model auf ein Hybridmodell gibt es jedoch noch Verbesserungsbedarf. Das Verlieren von Einheiten ist eine Herausforderung, die nicht dazu ermutigt Classic Account Modelle zu migrieren. Es bleibt abzuwarten, ob sich die SAP dieses Problems annimmt.
Spannend ist es auch abzuwarten, ob SAP den Standard-Content migriert oder neuen Content erstellt.
Weitere Informationen finden sich unter dem Link (https://saphanajourney.com/sap-analytics-cloud/resources/sap-analytics-cloud-new-model/) oder in der Hilfe in der SAC. Die anderen Erkenntnisse leiten sich durch Try & Error ab (Stand 28.04.2021).
Ansprechpartner


")


