SAP Analytics Cloud: Story vs. Application

Entscheidungshilfe, wann welche Lösung genutzt werden soll

Die SAP Analytics Cloud (SAC) ist das strategische Datenanalysestool der SAP, welches Business Intelligence-, Dashboarding-, Visualization-, Planning- und Predictive Funktionalitäten in einer Lösung vereint. Um die Daten auszuwerten oder zu planen bietet SAP nun zwei Ansätze – die Story oder die Analytic Application.


Einführung

Durch den Self-Service Ansatz unter Data Discovery (Vorschlagen von Storys) wird es ermöglicht, Fachabteilungen selbst in den Daten-Visualisierungsprozess einzubinden. Durch künstliche Intelligenz und Machine Learning schlägt die SAC schon heute Storys vor, die ohne vielen weiteren Aufwand, brauchbare Insights liefern. Jedoch gibt es noch eine andere Art, wie Daten visualisiert werden können, und zwar mit Analytic Applications. Diese sollen laut der SAP deutlich flexibler als Storys sein und können somit Kundenwünschen besser entsprechen. Diese Flexibilität wird in dem Application Designer, der deutlich von der Arbeitsumgebung von Stories abweicht, durch Scripting ermöglicht. Dies wird durch einen höheren Erstellungsaufwand erkauft.

In diesem Blogeintrag wird der Unterschied von Storys zu Analytic Applications aufgezeigt. Wann es womöglich Sinn ergibt, eine Story zu verwenden oder eben eine Analytic Application. Des Weiteren geht es um die Frage, ob die Fachabteilung Analytic Applications ohne Unterstützung durch die IT gewinnbringend nutzen und aufbauen kann. Es gibt zwar schon einen Blog, der die Vorteile von einer Analytic Application aufzeigt, jedoch noch keinen direkten Vergleich im deutschsprachigen Raum (Link siehe unten).


Allgemein

Sowohl Storys als auch Analytic Application dienen dazu, die aufbereiteten Daten verständlich zu präsentieren und visualisieren. Denn erst durch eine zielgruppendefinierte, klare und verständliche Datenvisualisierung kann das volle Potenzial der Daten ausgeschöpft werden. Hierbei können Tabellen, Graphen, Diagramme und weitere Visualisierungselemente zum Einsatz kommen. Mit Hilfe dieser Elemente wird ein tiefer Einblick in das Business und die Organisation ermöglicht.


Story

Die Story zeichnet sich durch ein klares und einfaches Konzept aus, welches ohne großen Aufwand eingerichtet werden kann. Die Visualisierung von einfachen Szenarien und Fragestellung stehen im Vordergrund, genauso wie die losgelöste Planung. Bei komplexeren Fragestellungen oder einem umfassenden integrierten Planungsprozess stößt die Story schnell an ihre Grenzen.

Die Erstellung und Bearbeitung von Stories kann schnell erlernt werden, weswegen Sie ideal für den Self-Services ist und nicht ein umfassendes Knowhow voraussetzt. Dies wird durch eine dialog-geführte Bedingung verstärkt, welche sowohl vom Ersteller als auch vom Nutzer leicht zu bedienen ist.

Bei der Erstellung einer Story muss nur einmalig entschieden werden, welches Grundlayout gewählt werden soll. Nach der Entscheidung, beispielsweise eines responsiven Layouts, braucht es kein Gedanke an die Skalierbarkeit der Story auf mobilen Endgeräten wie Tablets oder Handy verschwendet werden. Dies wird automatisch gewährleistet.


Analytic Application

Analytic Application sind dazu geeignet komplexe Anforderungen abzubilden. Diese Anforderungen können sich durch Szenario, Fragestellung, Funktionalitäten, Darstellungen und/oder Nutzerführung ausdrücken. Auf Grund vielfältiger Ziele sollte ein Konzept erstellt werden, wobei die Erwartungen und Funktionalitäten klar herausgearbeitet werden sollten. Denn durch personalisierte Benutzerführungen, Skripting Logiken, Drill-Downs kann schnell ohne ein vernünftiges Konzept, die Übersichtlichkeit verloren gehen. Mit einem ausgefeilten Konzept können komplexe Zusammenhänge im Reporting oder in einer umfassenden Planung umgesetzt und Nutzerführung deutlich personalisierter werden.

Die Erstellung ist deutlich aufwendiger und setzt mehr technisches Knowhow und Grundverständnis voraus, da die grafischen Elemente sich mit Hilfe von Scripting beeinflussen und verändern lassen. Um eine reibungslose Nutzung der Analytic Application zu gewährleisten, muss somit Scripting betrieben werden. Zusätzliche Funktionen sind neben der Veränderung von fast jedem visuellen Element, das Arbeiten mit Buttons, Pop Ups, Scripting und dem Odata Services. Wer Lumira kennt, wird sich hier schneller zurechtfinden und wissen, wo die Fallstricke lauern, aber auch, welches Potenzial möglich ist. Außerdem ist der Aspekt der Wartbarkeit zu beachten, da Anpassungen ebenfalls höheren Aufwand darstellen als bei Stories.


Funktionsvergleich

In der folgenden Tabelle wird ein Überblick über die wichtigsten Features geben und wo diese verfügbar sind. Diese Liste erhebt keinen Anspruch auf Vollständigkeit und will auch nicht die Details beschreiben, da der Blog nur eine Entscheidungshilfe ist und nicht tiefgehend die technischen Unterschiede analysiert.

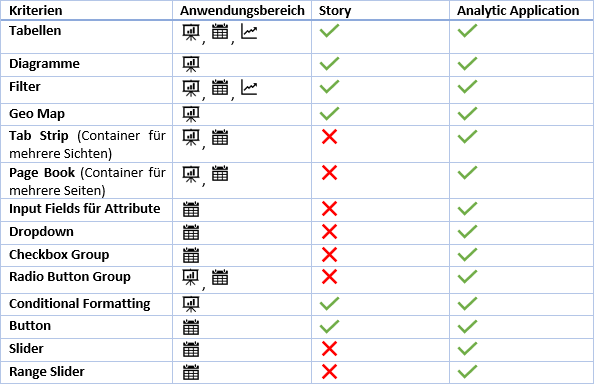
Data Action Trigger unterscheiden sich in der Verwendung. In der Story kann eine Data Action nur über den Standardbutton getriggert werden. In der Analytic Application kann sie über diverse andere Userinteraktionen ausgelöst werden. Den Data Analyzer kann nicht aus einer Story heraus aufgerufen werden. Ohne das Erstellen einer Story kann er über einen angepassten URL aufgerufen werden. In einer Analytic Application ist es jedoch mit einem Befehl ohne Probleme möglich.


Fazit

Ich empfehle nicht als Erstes zu überprüfen, ob eine Analytic Application Sinn ergibt, sondern ob es möglich ist, seine Anforderungen mit einer Story umzusetzen. Dadurch können Aufwände eingespart werden und man kommt nicht in Versuchungen seine Anforderungen komplexer zu machen, als sie eigentlich sind. Erst wenn es nicht möglich ist, seine Anforderungen umzusetzen, sollte man sich der Analytic Application zuwenden.

Wenn mit Analytic Applications gearbeitet wird, ist es wichtig, dass klare Anforderungen und Erwartungen kommuniziert und diese festgelegt und nicht des Öfteren Anpassungen vorgenommen werden. Dies ist einer der häufigsten Gründe, warum Projekte in dem Bereich aus dem Budget laufen.

Des Weiteren kann festgehalten werden, dass für die Analytic Application schon eine gewisse IT-Affinität vorausgesetzt wird und das eine Fachabteilung, die keine Programmier- oder Scriptingkenntnisse hat, hier nicht so schnell weiterkommen wird.

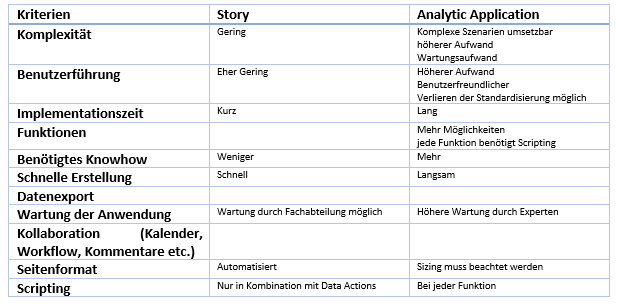
Zusammenfassung der verschiedenen Kriterien:

Ansprechpartner

Julius Nordhues

Consultant

Data Products Setup

I’ll start with Data Products setup. If you’re new to the concept, this recent video is a great starting point, but here’s a short summary. A data product is a well-described, easily discoverable, and consumable collection of data sets.

Creating a Data Product in Datasphere

Note that in this article I create Data Products in the Data Sharing Cockpit in Datasphere. This functionality is expected to move into the Data Product Studio, but that had not taken place at the time writing.

Before creating a Data Product in Datasphere, I need to set up a Data Provider profile, collecting descriptive metadata like contact and address details, industry, regional coverage, and importantly define Data Product Visibility. Enabling Formations allows me to share the Data Product with systems across your BDC Formation – Databricks, in this case.

With the Data Provider set up, I can go ahead and create a Data Product. As with the Data Provider, I’ll need to add metadata about the product and define its artifacts – the datasets it contains. Only datasets from a space of SAP HANA Data Lake Files type can be selected. Since this Data Product is visible across the Formation, it is available free of charge.

For this demo, the artifact is a local table containing ten years of Ice Cream sales data. Since this is a File type space, importing a CSV file directly to create a local table isn’t an option (see documentation).

I used a Replication Flow to perform an initial load from a BW aDSO table into a local table.

Once Data Product is created and listed, it becomes available in the Catalog & Marketplace, from where it can be shared with Databricks by selecting the appropriate connection details.

Jump into Databricks

To use the shared object In Databricks, I need to mount it to the Catalog – either by creating a new Catalog or using an existing one.

Databricks appends a version number to the end of the schema – ‘:v1’ – to maintain versioning in case of any future changes to the Data Product.

Once the share is mounted, the schema is created automatically, and the Sales actual data table becomes available within it. From there, I can access the shared table directly in a Notebook.

Creating a Data Product in Databricks

To create a Data Product in Databricks, I first need to create a Share – which I can either do via the Delta Sharing settings in the Catalog:

Or directly out of the table which is going to become a part of the Share:

Since a single Share can contain multiple tables, I have the option to either add the table to an existing Share, or create a new one:

To publish the Share as a Data Product, I run a Python script where I define the target table for the forecast and describe the Share in CSN notation, setting the Primary Keys. Primary Keys are required for installing Data Products in Datasphere.

Jump back into Datasphere

Once the Databricks Data Product is available in Datasphere, I install it into a Space configured as a HANA Database space – since my intention is to build a view on top of the table and use it for planning in SAC.

There are two installation options: as a Remote table for live data access, or as a Replication Flow, in which case the data is physically copied into the object store in Datasphere.

Since I want live access, I install it as a Remote Table:

and build a Graphical view of type Fact on top:

Forecast calculation

With my Data Products set up and Sales actual data are available in Databricks, I create a Notebook to calculate the Sales Forecast.

The approach combines Sales and Weather data to train a Linear Regression model. I import the Weather data *https://zenodo.org/records/4770937 from an external server directly into Databricks, select the relevant features from the weather dataset, and combine them with the Sales actual data:

* Klein Tank, A.M.G. and Coauthors, 2002. Daily dataset of 20th-century surface
air temperature and precipitation series for the European Climate Assessment.
Int. J. of Climatol., 22, 1441-1453.
Data and metadata available at http://www.ecad.eu

Using the “sklearn” library, I build and train a Linear regression model:

Once trained, the model predicts the Sales forecast for Rome in June 2026 based on the weather forecast, and I save the results to my Catalog table:

Seamless planning data model

Seamless planning concept is built around physically storing planning data and public dimensions directly in Datasphere, keeping them alongside the actual data.

Since the QRC4 2025 SAC release, it has also been possible to use live versions and bring reference data into planning models without replication.

In this scenario, I build a seamless planning model on top of the Graphical view I created over the Remote table. This lets me use the forecast generated in Databricks as a reference for the final SAC Forecast version.


The model setup follows these steps:

Create a new model:

Start with data:

Select Datasphere as the data storage:

From there, I define the model structure and can review the data in the preview.

For a deeper dive into Seamless Planning, I recommend this biX blog.

Process Flow automation

Multi-action triggers Datasphere task chain

The final step is automating the entire forecast generation by using SAC Multi-actions and a Task-Chain in Datasphere – so that my user can trigger the calculation with a single button click from an SAC Story.

The model setup follows these steps:

Create a new model:

Triggering Task Chains from Multi-actions is a recent release. This blog post walks through how to set it up.

For details on how to trigger a Databricks Notebook from Datasphere, I recommend referring to this blog.

With everything in place, I create a Story, add my Seamless planning Model, and attach the Multi-action:

Running the Multi-action triggers the Task Chain, which in turn triggers the Databricks Notebook.

I can monitor the execution details in Datasphere:

and in Databricks:

Once the calculation completes, the updated forecast appears in the Story:

The end-to-end calculation took 2 minutes 45 seconds in total. The Task Chain in Datasphere is triggered almost instantly by the Multi-action, the Databricks Notebook execution itself took 1 minute 29 seconds, with the remaining time spent on Serverless Cluster startup.   


From here, I can copy the calculated forecast into a new private version:

adjust the numbers as needed, and publish it as a new public version to Datasphere:

Conclusion

With SAP Business Data Cloud, it is possible to build a forecasting workflow that feels seamless to the end user — even though it spans multiple systems under the hood.

Companies using BW as the main Data Warehouse and Databricks for ML calculations or Data Science tasks can benefit from using the platform, as the data no longer needs to be physically copied out of BW.

What this scenario demonstrates is that once wrapped as a Data Product, BW sales data can be shared with Databricks via the Delta Share protocol. Databricks, in turn, can then create its own Data Products on top of the calculation results and share them back with Datasphere as a Remote Table.

A Seamless Planning model in SAC sits on top of that Remote Table, giving planners live access to the generated forecast. A single Multi-action in an SAC Story ties it all together, triggering a Datasphere Task Chain that kicks off the Databricks Notebook — completing the full cycle in under three minutes.

As SAP Business Data Cloud continues to mature, scenarios like this one are becoming achievable – leaving the complexity in the architecture and not in the workflow.

Ansprech­partner

Ilya Kirzner
Consultant
biX Consulting
Datenschutz-Übersicht

Diese Website verwendet Cookies, damit wir dir die bestmögliche Benutzererfahrung bieten können. Cookie-Informationen werden in deinem Browser gespeichert und führen Funktionen aus, wie das Wiedererkennen von dir, wenn du auf unsere Website zurückkehrst, und hilft unserem Team zu verstehen, welche Abschnitte der Website für dich am interessantesten und nützlichsten sind.